

One way to trick you is not starting the Y axis at zero.

Another way to trick you is having number that are way too big on the Y axis

Outliers/Data manipulation

E.G you wouldn't use a pie chart when showing something that changes aertime
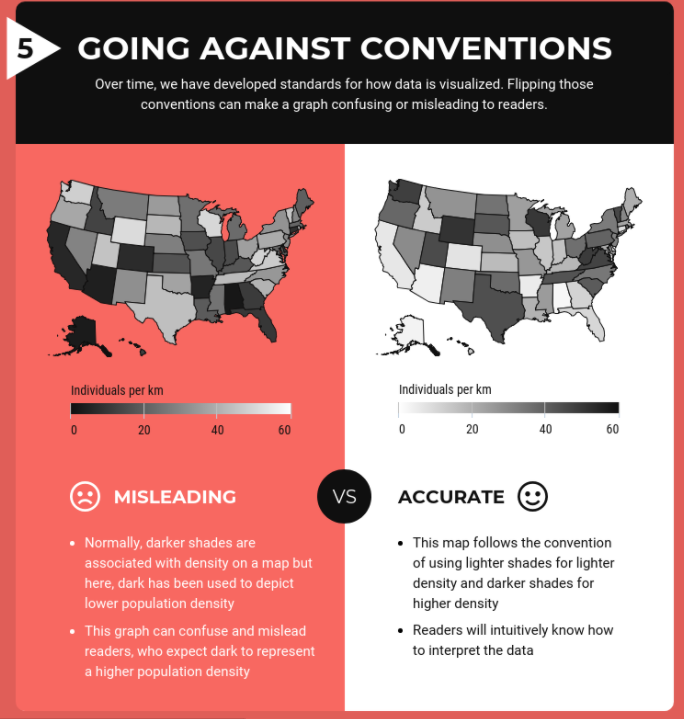
Going against convention means doing things NOT in the normal - E.G having green to mean stop
and read to mean go.
No comments:
Post a Comment